With nearly 60% of your leads coming from online today, the statement that your website is your most important asset today in terms of prospect acquisition is completely accurate. While it’s easy to understand the basics of website analytics, the basis only give you a small piece of the puzzle. Website analytics aren’t just to report on website performance, it also tells the story of the prospect’s journey on your website. How and why your prospects use your website is, in many cases, more important that it’s overall performance. While traffic is top of mind to most, how that traffic interacts with your website is even more important. Here at two often overlooked functions that you can dive into inside Google analytics that will help you understand how your website visitors interact with your website.
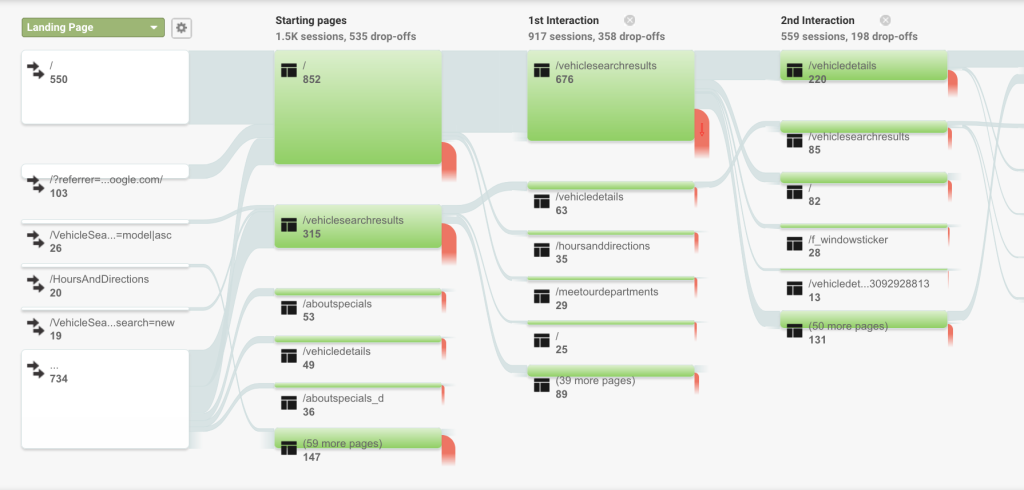
The first is behavior flow and it’s a report in analytics most dealerships never seem to pay attention to, but a very important one. Using behavior flow allows you to understand the journey a consumer takes on your website. From how they arrived, to where they left. This is important because it will allow you dissect a number of different things to help your website perform better overall. For starters you can evaluate how different traffic sources are performing. For example, if you find that the majority of your paid search traffic points visitors to your homepage, and the vast majority leave your website from there, it’s time to adjust your paid search campaigns. Or if a large portion of your organic traffic comes to the homepage and leaves right away, perhaps it’s time to come up with more engaging homepage content like better banners in your rotator, or more aggressive offers in the rotator that intrigue consumers into clicking and exploring. Understanding how prospects interact with you website at a more granular level helps you make needed adjustments.
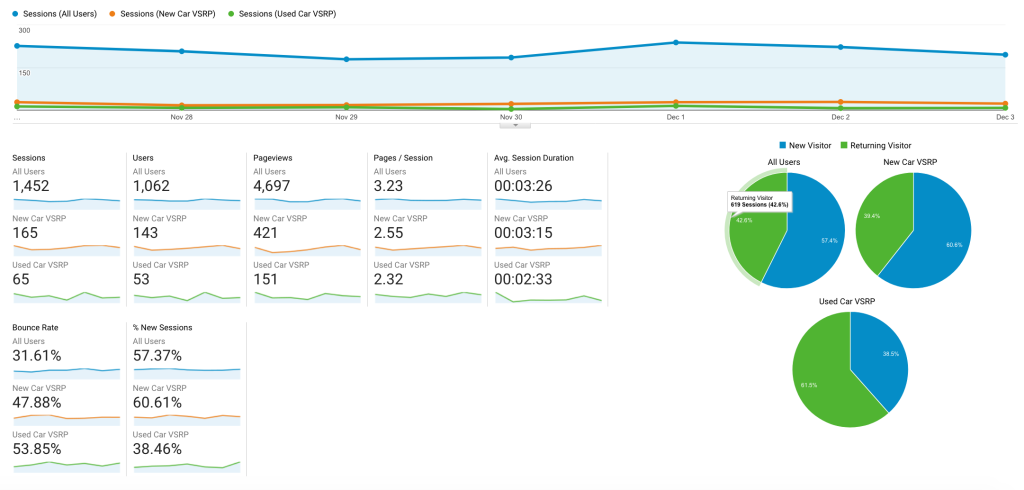
The second set of analytic data you should be looking into is using segments. Segments help you (you guessed it) segment website data to understand, not only interactions, but also overall website usage percentages. For example, while nearly all of your website traffic will visit your homepage, a smaller number will search a new or used car search results page or a look at VDP. In the above example we have overall traffic vs new and used car SRP results. As you can see new car SRP is outperforming used on all levels. But this example above is only the tip of the iceberg. You can get as granular as you’d like. Compare specific VDP or VSRP traffic that is specific to a certain model and see how engagement is with each vehicle. Are any particular vehicles not performing the way you would hope? If so this will help you to begin to understand how people engage with those vehicle results. For example, if you have a large number of one specific model that tends to be your bread and butter but you have poor VSRP engagement, perhaps it’s time to take a look at the pictures you’re using. Are they fresh? Is the background cluttered? Would you click on that specific vehicle if you were in the market?
Paying attention to website analytics that go deeper than what your current website vendor provides will give you a far better understanding of your website’s true performance and what changes and adjustments you can make to improve it. If you feel the need to consult an automotive website analytics specialist, click here.


